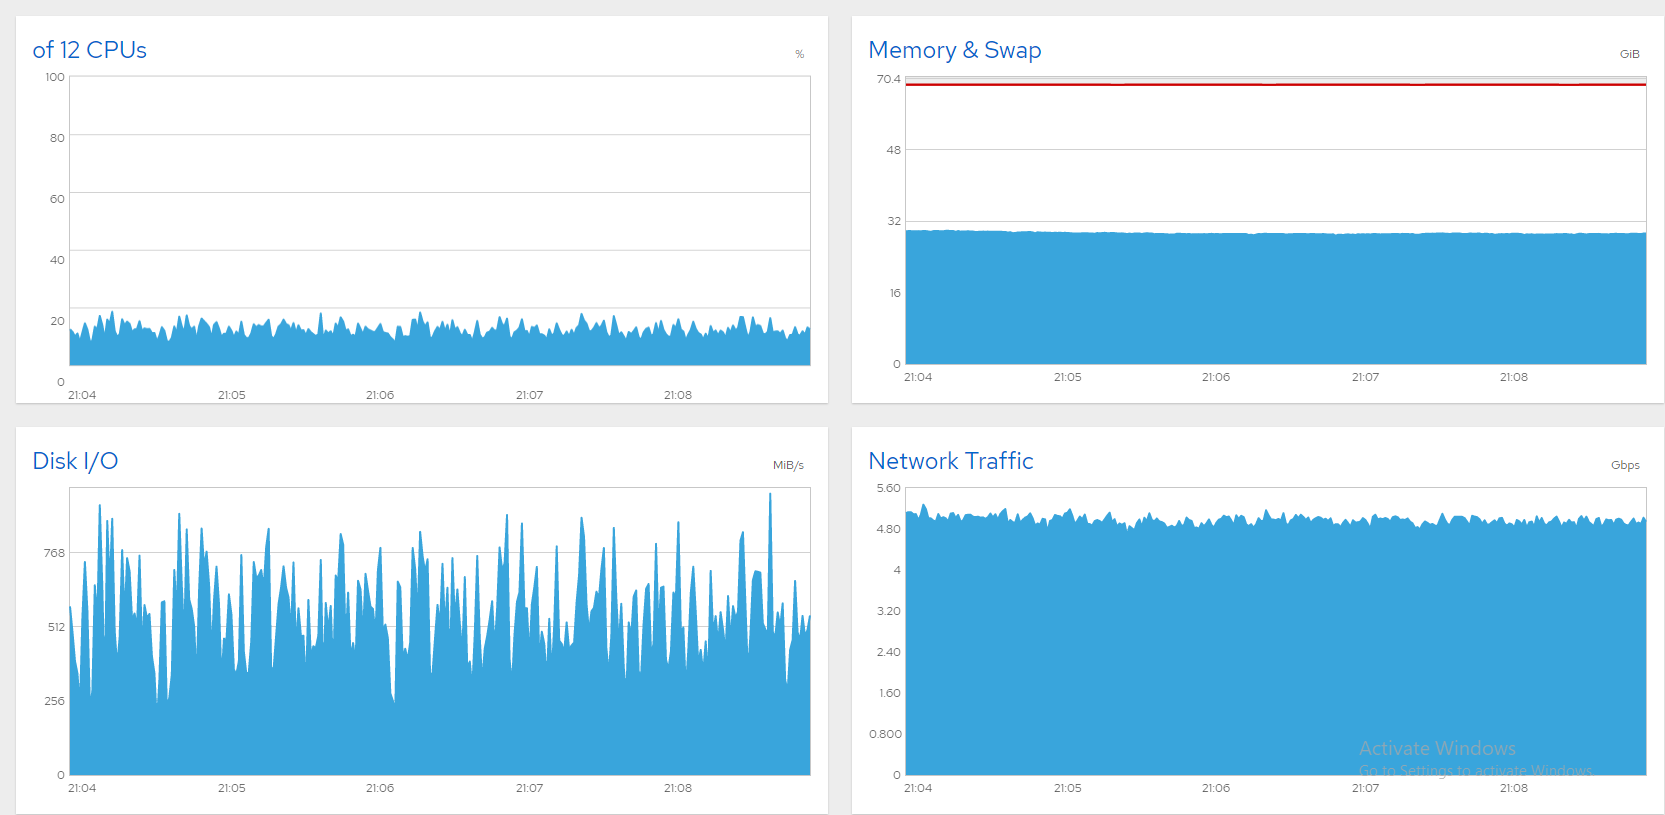
A quick background; I have a 10Gbit file server with six data SSDs running CentOS 8 and I'm struggling to saturate the line. Everything's fine if I cap bandwidth at 5 or 6Gbps. Here's some charts from Cockpit showing all is well (~850 concurrent users, 5Gbps cap).

Unfortunately when I push higher the bandwidth fluctuates in giant waves. Typically that's a sign of a saturated disk (or SATA card), and on Windows boxes I've solved that like this:
- Open "Resource Monitor".
- Select the "Disk" tab.
- Watch the "Queue Length" charts. Any disk/raid with a queue length steadily above 1 is a bottleneck. Upgrade it or reduce its load.
Now I'm seeing these symptoms in a CentOS 8 server but how do I finger the culprit? My SATA SSDs are split into three software RAID0 arrays like this:
    # cat /proc/mdstat
    Personalities : [raid0]
    md2 : active raid0 sdg[1] sdf[0]
          7813772288 blocks super 1.2 512k chunks

    md0 : active raid0 sdb[0] sdc[1]
          3906764800 blocks super 1.2 512k chunks

    md1 : active raid0 sdd[0] sde[1]
          4000532480 blocks super 1.2 512k chunks`
iostat fluctuates wildly and usually has a high %iowait. If I'm reading this right it seems to indicate md0 (sdb+sdc) has the largest load. But is it a bottleneck? After all, %util is nowhere near 100.
# iostat -xm 5
avg-cpu:  %user   %nice %system %iowait  %steal   %idle
           7.85    0.00   35.18   50.02    0.00    6.96

Device            r/s     w/s     rMB/s     wMB/s   rrqm/s   wrqm/s  %rrqm  %wrqm r_await w_await aqu-sz rareq-sz wareq-sz  svctm  %util
sda            106.20   57.20      0.89      0.22     3.20     0.00   2.93   0.00  136.87  216.02  26.82     8.56     3.99   0.92  14.96
sde            551.20    0.00    153.80      0.00    65.80     0.00  10.66   0.00    6.75    0.00   3.44   285.73     0.00   0.64  35.52
sdd            571.60    0.00    153.77      0.00    45.80     0.00   7.42   0.00    6.45    0.00   3.40   275.48     0.00   0.63  35.98
sdc            486.60    0.00    208.93      0.00   305.40     0.00  38.56   0.00   20.60    0.00   9.78   439.67     0.00   1.01  49.10
sdb            518.60    0.00    214.49      0.00   291.60     0.00  35.99   0.00   81.25    0.00  41.88   423.52     0.00   0.92  47.88
sdf            567.40    0.00    178.34      0.00   133.60     0.00  19.06   0.00   17.55    0.00   9.68   321.86     0.00   0.28  16.08
sdg            572.00    0.00    178.55      0.00   133.20     0.00  18.89   0.00   17.63    0.00   9.81   319.64     0.00   0.28  16.00
dm-0             5.80    0.80      0.42      0.00     0.00     0.00   0.00   0.00  519.90  844.75   3.69    74.62     4.00   1.21   0.80
dm-1           103.20   61.40      0.40      0.24     0.00     0.00   0.00   0.00  112.66  359.15  33.68     4.00     4.00   0.96  15.86
md1           1235.20    0.00    438.93      0.00     0.00     0.00   0.00   0.00    0.00    0.00   0.00   363.88     0.00   0.00   0.00
md0           1652.60    0.00    603.88      0.00     0.00     0.00   0.00   0.00    0.00    0.00   0.00   374.18     0.00   0.00   0.00
md2           1422.60    0.00    530.31      0.00     0.00     0.00   0.00   0.00    0.00    0.00   0.00   381.72     0.00   0.00   0.00
dm-2             0.00    0.00      0.00      0.00     0.00     0.00   0.00   0.00    0.00    0.00   0.00     0.00     0.00   0.00   0.00
loop0            0.00    0.00      0.00      0.00     0.00     0.00   0.00   0.00    0.00    0.00   0.00     0.00     0.00   0.00   0.00

avg-cpu:  %user   %nice %system %iowait  %steal   %idle
           5.14    0.00   22.00   72.86    0.00    0.00

Device            r/s     w/s     rMB/s     wMB/s   rrqm/s   wrqm/s  %rrqm  %wrqm r_await w_await aqu-sz rareq-sz wareq-sz  svctm  %util
sda             34.00   37.40      0.15      0.15     5.20     0.00  13.27   0.00  934.56  871.59  64.34     4.61     4.15   0.94   6.74
sde            130.80    0.00     36.14      0.00    15.00     0.00  10.29   0.00    5.31    0.00   0.63   282.97     0.00   0.66   8.64
sdd            132.20    0.00     36.35      0.00    14.40     0.00   9.82   0.00    5.15    0.00   0.61   281.57     0.00   0.65   8.62
sdc            271.00    0.00    118.27      0.00   176.80     0.00  39.48   0.00    9.52    0.00   2.44   446.91     0.00   1.01  27.44
sdb            321.20    0.00    116.97      0.00   143.80     0.00  30.92   0.00   12.91    0.00   3.99   372.90     0.00   0.91  29.18
sdf            340.20    0.00    103.83      0.00    71.80     0.00  17.43   0.00   12.17    0.00   3.97   312.54     0.00   0.29   9.90
sdg            349.20    0.00    104.06      0.00    66.60     0.00  16.02   0.00   11.77    0.00   3.94   305.14     0.00   0.29  10.04
dm-0             0.00    0.80      0.00      0.01     0.00     0.00   0.00   0.00    0.00 1661.50   1.71     0.00    12.00   1.25   0.10
dm-1            38.80   42.20      0.15      0.16     0.00     0.00   0.00   0.00  936.60 2801.86 154.58     4.00     4.00   1.10   8.88
md1            292.60    0.00    111.79      0.00     0.00     0.00   0.00   0.00    0.00    0.00   0.00   391.22     0.00   0.00   0.00
md0            951.80    0.00    382.39      0.00     0.00     0.00   0.00   0.00    0.00    0.00   0.00   411.40     0.00   0.00   0.00
md2            844.80    0.00    333.06      0.00     0.00     0.00   0.00   0.00    0.00    0.00   0.00   403.71     0.00   0.00   0.00
dm-2             0.00    0.00      0.00      0.00     0.00     0.00   0.00   0.00    0.00    0.00   0.00     0.00     0.00   0.00   0.00
loop0            0.00    0.00      0.00      0.00     0.00     0.00   0.00   0.00    0.00    0.00   0.00     0.00     0.00   0.00   0.00
Meanwhile server performance is atrocious. Every keystroke over SSH takes seconds to register, the GNOME desktop's virtually unresponsive, and users report dropped connections. I'd show Cockpit charts but the login times out. Capping the bandwidth works beautifully but I'd like to unlock the rest. So how can I identify the bottleneck(s)? I'd love some suggestions!
The culprit was sda, the magnetic CentOS disk. Most of the evidence pointed there. As someone commented (and seems to have deleted), the wait times on sda, dm-0, and dm-1 look suspicious. Sure enough, dm-0 (root) and dm-1 (swap) are also on sda. Watching iotop run, the bottleneck seemed to be triggered by a quick flash of Gnome activity followed by kswapd (swap) clogging the works. Closing Gnome with an "init 3" made a definite improvement, but there's no way a machine this powerful should be crippled by an idle login screen. SMART also reports 8000+ bad sectors on sda. My guess is many of these are in the swap space, causing swaps to cripple the system.
One thought was to move the swap to another disk but replacing sda seemed more practical. I started a disk clone with CloneZilla but it was estimating 3 hours and a fresh install would be faster, so I went with that. Now the server's running great! Here's a screen shot showing 1300+ files streaming simultaneously over 8Gbps, nice and stable. Problem solved!